The Chart2D Tutorial
What is Chart2D?
What are some examples of Chart2D objects?
What are all the public Chart2D classes and what do they do?
How do I configure a Chart using LBChart2D?
How do I
configure a LineArea Chart using LBChart2D?
How do I add a Legend to a Chart?
How do I add a Trend Line to a Graph Chart?
How do I add a Warning Region to a Graph Chart?
How do I configure a Graph Chart with Cat Coloring?
How do I configure a PieChart2D object?
How should I use Chart2D to maximize performance and minimize memory usage?
Chart2D is a Java class library for visualizing data using two-dimensional graphical "objects". The library is named Chart2D because it provides charts such as Pie Charts and Graph Charts. Using Chart2D requires gaining some knowledge of Java and Swing in particular. These graphical objects that Chart2D produces are extensions of the JComponent class. As you should know, JComponent objects can be added to Swing interfaces as GUI components. The Chart2D objects (that extend JComponent) are special in that they do not need to be added to a GUI in order to be used. Chart2D objects can be created, sized, and exported to BufferedImage objects. BufferedImage objects can be encoded to graphical files such as jpeg or png.
What are some examples of Chart2D objects?
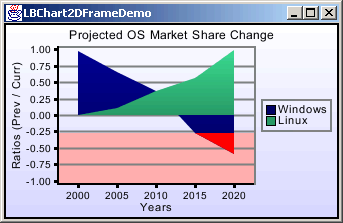
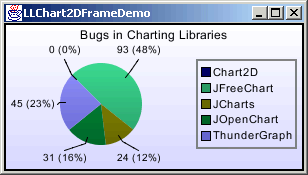
Below are sample images of Chart2D objects inside JFrames.
| LBChart2D (Float, Lines, Warning Region, Legend) |
 |
| LLChart2D (Integer, Bars, Cat Coloring) |
 |
| PieChart2D (Integer) |
 |
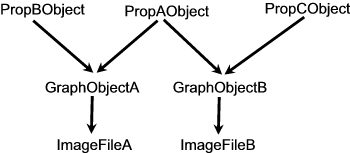
There are three basic chart types: LBChart2D, LLChart2D, and PieChart2D. They all share a common configuration process. There are two types of objects that you will need to configure: properties objects and graphical objects. Properties objects are objects that hold all the settings and information needed by a graphical object to determine how it should look. Graphical objects are the objects that are added to GUI's or that export BufferedImage objects of themselves. Properties are separated from graphical objects because many graphical objects share common properties. For example, Siperian likes to create two objects (one small jpeg without a legend and one large jpeg with a legend) in order to save screen space on the web interface; the two objects share all the properties except for the legend properties. In order to allow for such sharing of properties objects, some properties must be separate from other properties (for example the legend properties must be separated from the other properties). Thus there are multiple properties objects for every single graphical object.
What are all the public Chart2D classes and what do they do?
Recall that there are two types of classes: graphical classes (that can be added to GUI's or exported to BufferedImage objects) and properties classes that specify how the graphical classes should look. Here is a table describing the graphical classes.
| Graphical Classes | |
| LBChart2D | A "labels bottom" graph chart.* |
| LLChart2D | A "labels left" graph chart.** |
| PieChart2D | A pie chart. |
| * A vertical bar chart is an example of a LBChart2D. | |
| ** A horizontal bar chart is an example of a LLChart2D. | |
Here is a table describing the properties classes.
| Properties Classes | |
| Object2DProperties | Props for enclosure and title. |
| Chart2DProperties | Props for layout and data labels. |
| GraphChart2DProperties | Props for axes and graph layout. |
| PieChart2DProperties | Props for pie sectors and labels. |
| LegendProperties | Props for legend. |
| Dataset | Structure for holding data. |
| MultiColorsProperties | Props for generating visualization colors. |
| GraphProperties | Props for graph areas. |
| WarningRegionProperties | Props for warning regions of graph areas. |
Here is a table describing which properties classes are used by which graphical classes. Some graphical classes allow for the adding of multiple objects of particular graphical classes. For instance, a LBChart2D can have multiple Dataset objects added to it (for "overlay" graph charts). Some graphical classes only allow for the setting of one object of a particular properties class. The table indicates this with a "Many" for allowing multiple objects and an "One" for only allowing one object. There is one more item to explain. Graphical classes require the setting of some properties classes. For example, a Clocks2D object needs a Clocks2DProperties object before it can be used. The "Many" or "One" placed inside brackets "[]" indicates an optional properties class. The "Many" or "One" not inside brackets indicates a required properties class.
| Graphical Classes and their Properties Classes | |||
| LBChart2D | LLChart2D | PieChart2D | |
| Object2DProperties |
One |
One | One |
| Chart2DProperties | One | One | One |
| GraphChart2DProperties | One | One | - |
| PieChart2DProperties | - | - | One |
| LegendProperties | One | One | One |
| Dataset | Many | Many | One |
| MultiColorsProperties | Many | Many | One |
| GraphProperties | Many | Many | - |
| WarningRegionProperties | [Many] | [Many] | - |
How do I configure a Bar Chart using LBChart2D?
The LBChart2D object requires the configuration of at seven properties objects: Object2DProperties, Chart2DProperties, GraphChart2DProperties, LegendProperties, Dataset, MultiColorsProperties, and GraphProperties.
Let's begin configuring the Object2DProperties object. The Object2DProperties object contains seventeen settings for the object border, background, title, and gaps. Here is a basic graphic of the managed components.
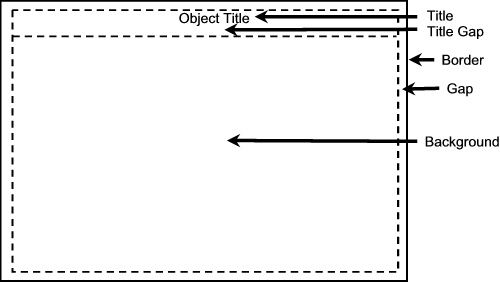
Generally a setting has an intelligent default value (for example the gap), but some settings should be passed personalized values (for example the title). Below is a table of the settings that are commonly used.
| Method | Description | Default Value |
| setObjectBorderColor (java.awt.Color) | Sets the color of the object's border. | Color.black |
| setObjectTitleFontColor (java.awt.Color) | Sets the color of the font for the object's title. | Color.black |
| setObjectTitleText (java.lang.String) | Sets the text for the object's title. | "" |
The actual configuration of an Object2DProperties object looks like this.
Object2DProperties
object2DProps = new Object2DProperties();
object2DProps.setObjectTitleText ("Title for this Object");
The next properties object to configure is a Chart2DProperties object. There are only three settings to this object. There are only two things that this object manages: (i) the gap between the legend and the rest of the chart and (ii) something called "the data labels precision". The data labels precision setting is a complex one. But basically it adjusts how the labels look. The setting doesn't affect the precision of the computations involved in painting the graph components. For example you might be charting cache size values (ex. 1 megabyte of cache being used); you may want the labels to read (1 MB instead of 1.134 MB); the setting also let's you adjust the look of labels from 1,123 MB to 1,500 MB (adding zeroes if that look is preferred). The current setting is to add up to three zeroes (if data gets that large). Here is a graphic depicting the area that fits within the titled area managed by the Object2DProperties object; the gap separates the legend area (on right) from the rest of the chart (on left).
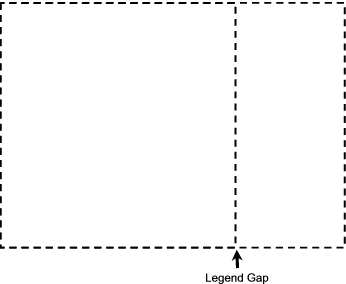
Using the defaults, the configuration of a Chart2DProperties object looks like this.
Chart2DProperties chart2DProps = new Chart2DProperties();
The next properties object to configure is a LegendProperties object. There are twenty-two settings customizing the legend border, labels, label bullets, and gaps. Here is a basic graphic of the managed components. The graphic depicts an area that fits within the legend area managed by the Chart2DProperties object.
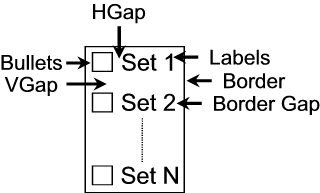
Here are a few methods that you may want to use.
| Method | Description | Default Value |
| setLegendExistence (boolean) | Sets whether there will exist a legend on the chart. | false |
| setLegendBorderColor (java.awt.Color) | Sets the color of the border around the legend. | Color.black |
| setLegendLabelsFontColor (java.awt.Color) | Sets the color of the font of the legend's labels. | Color.black |
| setLegendLabelsTexts (java.lang.String[]) | Sets the texts of the legend labels. | new String[0] |
For example, let's assume you didn't want a legend for your Chart. In that case, you would configure the object like this.
LegendProperties
legendProps = new LegendProperties();
legendProps.setLegendExistence (false);
The next properties object to configure is a GraphChart2DProperties object. There are fifty-six settings customizing the numbers axis, the labels axis, as well as the optional cat coloring of graph components. Here is a basic graphic of the managed components. The graphic depicts an area that fits within the chart area managed by the Chart2DProperties object.
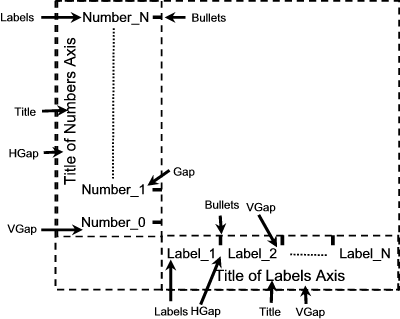
Here are a few settings you may want to use.
| Method | Description | Default Value |
| setNumbersAxisLabelsFontColor (java.awt.Color) | Sets the color of the font of the labels of the numbers axis. | Color.black |
| setChartDatasetCustomizeLeastValue (boolean) | Sets whether the true least value in the data sets will be substituted by the custom value. This effects the range of the labels of the numbers axis. | false |
| setChartDatasetCustomGreatestValue (float) | Sets the custom greatest value of the data sets. This value must be greater than or equal to the true greatest value of the data sets for it to be used. This effects the scale of the labels of the numbers axis. | 0 |
The "custom greatest value" setting is a complex setting, but it can be used in a simple way. For data that will always be within a known range (such as percentage data that will always be between zero and 100) it may be preferred to have the numbers labels be static rather than changing dynamically with the input data. You can set the "greatest value" at 100 for percentage data charts where desired.
Generally the actual creation and configuration of a GraphChart2DProperties need only look like this.
GraphChart2DProperties graph2DProps = new GraphChart2DProperties();
The next properties object to configure is a GraphProperties object. There are thirty-seven settings customizing the graph area's border, grid lines, and graph components (ex. vertical bars). Here is a basic graphic of the managed components. The graphic depicts an area managed by the GraphChart2DProperties object (to the right of the numbers axis and above the labels axis).

Here are a few settings you may want to use.
| Method | Description | Default Value |
| setGraphBorderLeftBottomColor (java.awt.Color) | Sets the color of the graph's left and bottom border. | Color.black |
| setGraphBorderRightTopColor (java.awt.Color) | Sets the color of the graph's right and top border. | Color.gray |
| setGraphLabelsLinesColor (java.awt.Color) | Sets the color of the vertical lines of this graph. | Color.gray |
| setGraphNumbersLinesColor (java.awt.Color) | Sets the color of the horizontal lines of this graph. | Color.gray |
The configuration of a GraphProperties object may look like this. "Bars" are the default graph components. Other choices are lines and dots, and any combination of bars, lines, and dots.
GraphProperties graphProps = new GraphProperties();
The next properties object to configure is a Dataset object. This object is different than the others in that, the Dataset object doesn't directly relate to any visual region; for instance a legend properties object relates to a legend area, but a Dataset object just contains the data for a chart. As a result, there are fewer configuration methods. We only need to use methods that add data to the object. Their are two ways to create and configure a Dataset object: (i) you can create an empty Dataset and add data to it as you require or (ii) you can create a Dataset of a known size and "set" your data. The second way has better performance, but the size of the Dataset object needs to be known upon creation. The Dataset object's internal resources are Vectors of java.lang.Float objects. Even if data only requires precision of Integer, using the extra precision of Float objects is satisfactory.
A Dataset object is like a third order float array, for instance float[numSets][numCategories][numItems]. Why would we use a third order array? Well consider if we were graphing the number of hours someone worked every week for the last two years. We could have two sets of data, data for year 2002 and data for year 2001; this would be the first order (also called the "set" order). Now having 52 labels (one label for each week) on the "labels axis" would be too many labels, so we could categorize the data for each year by month having only 12 labels instead; this would be the second order (also called the "cat" order). Lastly which data was for which week of each month would require another order; this is called the third order (or the "item" order). Most of Siperian's bar charts have 1 set, 24 categories per set, and 1 item per category. The configuration of such a Dataset object may look like this.
Dataset
dataset = new Dataset (1, 24, 1);
dataset.set (0, 0, 0, data1) //where data1 is your first value (ex. 23f)
dataset.set (0, 1, 0, data2) //where data2 is your second value (ex. 56f)
dataset.set (0, 2, 0, data3) //where data3 is your third value (ex. 185f)
...
dataset.set (0,23, 0, data24) //where data24 is your last value (ex. 3f)
The last properties object that needs to be configured is the MultiColorsProperties object. It too is special like the dataset in that it isn't directly related with a visual area. This object has settings for selecting a series of colors that color the graph components (ex. the vertical bars). It can automatically choose colors for you of "CHART2D", "NATURAL", and "PASTEL". It can also be passed an array of colors for use. This object is very smart; if there isn't enough colors then the colors are repeated. Currently all automatic types have twelve distinct colors. A MultiColorsProperties is generally configured in this way.
MultiColorsProperties multiColorsProps = new MultiColorsProperties();
After having configured all the necessary properties objects, a LBChart2D object must be created and configured. Remember that the LBChart2D object is the graphical object (the object that can be added to a GUI or can be exported to a BufferedImage object). You begin configuring a LBChart2D object in this way.
LBChart2D lbChart2D = new LBChart2D();
lbChart2D.setObject2DProperties (object2DProps);
lbChart2D.setChart2DProperties (chart2DProps);
lbChart2D.setLegendProperties (legendProps);
lbChart2D.setGraphChart2DProperties (graphChart2DProps);
lbChart2D.addGraphProperties (graphProps);
lbChart2D.addDataset (dataset);
lbChart2D.addMultiColorsProperties (multiColorsProps);
LBChart2D objects have layout ratios. They affect the layout of the legend, axes, and graph. How they affect these is complex to explain. Expert settings of these is not necessary. Basically the layout algorithms takes some large amount of space (i.e. the maximum size of the graph chart) and allocates it to each of the graph chart components according to the layout ratios; generally the components don't require as much space as was given to it and they reset their ratios according to the minimum space they need. That is why the ratios don't need to be accurate: (i) they are applied to a much larger amount of space than generally is necessary (ii) they are readjusted for the particular graph chart at hand. Read the javadoc for the "setLayoutRatios (float, float, float)" method for more information.
The last steps of configuring the object depend on how you want to use it. If you want to add the object to a GUI, then treat it much the same as you would any JComponent. To encode to a file or print, then set the size and preferred size of the object either using "pack()" or the "setSize(Dimension)" and "setPreferredSize (Dimension)" methods. Pack sets the object to its auto-calculated preferred size and look like this.
lbChart2D.pack();
For adding to a Java Swing GUI, simply add the object to a Swing content pane such as JPanel. For encoding to a graph image file such as a jpeg, export the LBChart2D object to a BufferedImage object and perform the encoding. The BufferedImage object is obtained by calling the getImage() method like this.
BufferedImage lbImage = lbChart2D.getImage();
The last thing to mention is how to update the chart with new data/ information as necessary. The key is to always keep a reference (i.e. global variable) to the configured LBChart2D object. Given that you have the LBChart2D object, you can access any of the objects "Properties" objects that you passed to it during original configuration. Simply change any of the Properties objects by calling the appropriate "set" methods. Once the Properties objects have been modified, the changes will be automatically reflected by the chart upon next "repaint()" for GUI display or "getImage()" for image encoding.
How do I configure a LineArea Chart using LBChart2D?
The following is an example of a LineArea Chart using LBChart2D.
A LBChart2D LineArea Chart is configured exactly like a LBChart2D Bar Chart except the LineArea Chart requires two extra setting to the GraphProperties objects. The GraphProperties bars must be disabled and the lines must be enabled. Use of these extra methods on a configured GraphProperties object looks like this. (Assume a GraphProperties object has been configured as described in the Bar Chart LBChart2D section.)
graphProps.setGraphBarsExistence (false);
graphProps.setGraphLinesExistence (true);
How do I add a Trend Line to a Graph Chart?
The following is an example of a GraphChart2D object with a trend line.
Adding a trend line to a graph chart is quite easy. There are three ADDITIONAL "properties objects" you'll need to configure: GraphProperties, Dataset, and MultiColorsProperties. That is, a second object of each needs to be configured (remember that one of each has already been configured for the raw data). The following discussion assumes a configured GraphChart2D object such as a Bar Chart using LBChart2D exists.
Configuration of the second GraphProperties object is similar to configuring the first. Generally you'll use a few additional methods when configuring the GraphProperties object for the trend. The addition methods turn the default graph components from "bar" to "line" (similar to configuring a GraphProperties object for a LineArea Chart LBChart2D). Below are summaries of the additional methods only.
| Method | Description | Default Value |
| setGraphBarsExistence (boolean) | Sets whether the graph contains bar components. | true |
| setGraphLinesExistence (boolean) | Sets whether the graph contains line components. | false |
| setGraphLinesFillInterior (boolean) | Sets whether the graph lines will made to form a shape (ie like a mountain range). | true |
| setGraphLinesThicknessModel (int) | Sets the thickness of the line components for the chart's model size. | 1 |
Assuming an extra configured GraphProperties objects exists (configured as described in the Bar Chart LBChart2D section), use of the additional methods looks like this.
trendGraphProps.setGraphBarsExistence (false);
trendGraphProps.setGraphLinesExistence (true);
trendGraphProps.setGraphLinesFillInterior (false);
trendGraphProps.setGraphLinesThicknessModel (2);
The next additional object we need is a Dataset object. The object needs data; specifically it needs data (i.e. trend data) that is based on the data (i.e. raw data) in the first Dataset object. Built in is a moving average function for its trend function. The number of categories and data items in each Dataset object (the raw object and the trend object) must be equal. There is an easy way of configuring the trend Dataset object once the raw Dataset object is created. Configuration looks like this.
Dataset
trendDataset = new Dataset (1,
dataset.getNumCats(),
dataset.getNumItems());
trendDataset.setMovingAverage (0, dataset, 5);
The "setMovingAverage" method may need some description. The "0" indicates the trend data should be placed in the first set. The "dataset" variable passes in the raw Dataset object for analysis. The "5" indicates how many items to analyze for each moving average item.
The last additional object that needs to be configured is the MultiColorsProperties object. You should choose a custom color here. One color (i.e. the trend line color) needs to be chosen.. Configuration of the trend MultiColorsProperties object looks like this.
MultiColorsProperties trendColorsProps = new MultiColorsProperties(); trendColorsProps.setColorsCustom (Color.yellow);
Now that the three additional properties objects are configured, they need to be added to the GraphChart2D object. Remember that object was called "lbChart2D". Adding these properties must come AFTER the adding of the other three original properties objects. The configuration of the GraphChart2D object with the original and additional properties objects looks like this.
LBChart2D lbChart2D = new LBChart2D();
...
lbChart2D.addGraphProperties (graphProps);
lbChart2D.addDataset (dataset);
lbChart2D.addMultiColorsProperties (multiColorsProps);
lbChart2D.addGraphProperties (trendGraphProps);
lbChart2D.addDataset (trendDataset);
lbChart2D.addMultiColorsProperties (trendColorsProps);
The remaining configuration and use of the "Trend Line" LBChart2D object is the same as described in the Bar Chart LBChart2D section.
How do I add a Legend to a Chart?
Legend's can be added to any object extending the Chart2D class. That means that legends can be added to LBChart2D, LLChart2D, and PieChart2D objects. Remember that even when configuring a Chart2D object without a legend, a LegendProperties object must be created and configured. Note this section assumes a configured Chart2D object such as a Bar Chart using LBChart2D exists.
Here are a few methods you may use.
| Method | Description | Default Value |
| setLegendExistence (boolean) | Sets whether there will exist a legend on the chart. | false |
| setLegendBorderColor (java.awt.Color) | Sets the color of the border around the legend. | Color.black |
| setLegendLabelsFontColor (java.awt.Color) | Sets the color of the font of the legend's labels. | Color.black |
| setLegendLabelsTexts (java.lang.String[]) | Sets the texts of the legend labels. | new String[] |
For a Chart2D object with a legend, the configuration of a LegendProperties object looks like this where "Set 1" and Set 2" can be any string labels for your sets of data.
LegendProperties
legendProps = new LegendProperties();
legendProps.setLegendLabelsTexts (new String[] {"Set 1", "Set
2"});
How do I add a Warning Region to a Graph Chart?
Warning regions can only be added to GraphChart2D objects. Adding a warning region requires configuring a WarningRegionProperties object. In fact, any number of warning regions can be added; each warning region requires its own WarningRegionProperties object. The following discussion assumes that a configured GraphChart2D object such as described in the Bar Chart LBChart2D section exists.
Warning regions are colored areas of graph charts. If a graph component (ex. a bar) enters that area, then that section of the component entering the area is of an alternative color. The area of the warning region is specified by indicating at which (data) values, high and low, the warning region should color. There are two special "values" that can be passed however: (i) TOP indicating the far edge of the graph and (ii) BOTTOM indicating the near edge of the graph. Siperian uses the following methods to configure the WarningRegionProperties objects.
| Method | Description | Default Value | Siperian Value |
| setBackgroundColor (java.awt.Color) | Sets the color that the graph background becomes in this region if the graph background exists. | new Color (250,221,230) | [depends] |
| setComponentColor (java.awt.Color) | Sets the color that any component entering this region should become. | new Color (220,000,050) | [depends] |
| setHigh (float) | Sets the high value of this warning region. | TOP | [depends] |
| setLow (float) | Sets the low value of this warning region. | BOTTOM | [depends] |
Configuration of a WarningRegionProperties object looks like this.
WarningRegionProperties
warningProps = new WarningRegionProperties();
warningProps.setHigh (WarningRegionProperties.TOP);
warningProps.setLow (6000);
warningProps.setComponentColor (new Color (250,221,230));
warningProps.setBackgroundColor (new Color (220,000,050));
The last step in adjusting a configured GraphChart2D object for having a warning region is adding the WarningRegionProperties objects to the GraphChart2D object. Adding the WarningRegionProperties object looks like this.
lbChart2D.addWarningRegionProperties (warningProps);
All other configuration and use is the same as described in the Bar Chart LBChart2D section.
How do I configure a Graph Chart with Cat Coloring?
"Cat Coloring" is where graph components are colored according to their category; by default they are colored according to their set. "Cat Coloring" was added late in the Chart2D API; it still has not fully been integrated with it. This is apparent when wanting a legend and Cat Coloring. The legend bullets can only be colored by set. The graph components can be colored by set or by category. This is also apparent in that "Cat Coloring" has no interpretation for Graph Charts with lines. Only use cat coloring for bar charts, dot charts, or bar-dot charts without legends. To enable Cat Coloring, two things need to occur; but first assume that a fully configured Graph Chart exists as described in the Bar Chart LBChart2D section.
For Cat Coloring, a new MultiColorsProperties object must be configured. Configuration of a MultiColorsProperties object for Cat Coloring looks like this.
MultiColorsProperties catColorsProps = new MultiColorsProperties();
For cat coloring to take effect, the existing GraphChart2DProperties object must have additional methods called on it. Calling the additional methods looks like this.
graphChart2DProps.setGraphComponentsColoringByCat
(true);
graphChart2DProps.setGraphComponentsColorsByCat (catColorsProps);
All other configuration and use is the same as described in the Bar Chart LBChart2D section.
How do I configure a PieChart2D object?
The PieChart2D object requires the configuration of six properties objects: Object2DProperties, Chart2DProperties, PieChart2DProperties, LegendProperties, Dataset, and MultiColorsProperties. The Object2DProperties and Chart2DProperties are configured in the same way as the LBChart2D Bar Chart. The other properties objects (besides PieChart2DProperties) are configured in a similar way to a LBChart2D Bar Chart. However in order to configure these objects correctly one must note that each pie sector (since it is of a different color) corresponds to a set in the dataset; remember by default coloring is by set. So for a pie with "n" sectors, one needs a Dataset object with "n" sets, and one also needs a MultiColorsProperties object with "n" custom colors (since Siperian always uses custom colors). Also if there is to be a legend for the Pie Chart, then it must have "n" labels. With that said, how to configure the LegendProperties, Dataset, and MultiColorsProperties should be known from reading the LBChart2D Bar Chart section. The only properties object left to describe the configuration of, is the PieChart2DProperties object.
For the PieChart2DProperties object, there are twenty-four settings customizing the pie sectors, pie labels, and pie sector labels lines, and gaps. Here is a basic graphic of the managed components. The graphic depicts an area that fits within the chart area managed by the Chart2DProperties object.
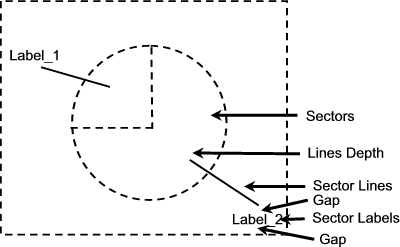
Again, many of the settings have intelligent default values. Currently Siperian is using the following customization methods only.
| Method | Description | Default Value | Siperian Value |
| void setPieLabelsFontColor (java.awt.Color) | Sets the color of the font of the pie labels. | Color.black | new Color (000,027,090) |
| setPieLabelsLinesColor (java.awt.Color) | Specifies the color of the lines relating each pie sector with its particular label. | Color.black | new Color (000,035,115) |
| setPieLabelsLinesDotsColor (java.awt.Color) | Specifies the color of the dots that exist at the beginning and ending of the lines relating each pie sector with its particular label. | Color.black | new Color (000,035,115) |
The actual configuration of a GraphChart2DProperties looks like this.
PieChart2DProperties
pieChart2DProps = new PieChart2DProperties();
pieChart2DProps.setPieLabelsFontColor (new Color (000,027,090));
pieChart2DProps.setPieLabelsLinesColor (new Color (000,035,115));
pieChart2DProps.setPieLabelsLinesDotsColor (new Color (000,035,115));
After having configured all the necessary properties objects, a PieChart2D object must be created and configured. Remember that the PieChart2D object is the graphical object (the object that can be added to a GUI or can be exported to a BufferedImage object). You begin configuring a PieChart2D object in this way.
PieChart2D pieChart2D = new PieChart2D();
pieChart2D.setObject2DProperties (object2DProps);
pieChart2D.setChart2DProperties (chart2DProps);
pieChart2D.setLegendProperties (legendProps);
pieChart2D.setPieChart2DProperties (pieChart2DProps);
pieChart2D.addDataset (dataset);
pieChart2D.addMultiColorsProperties (multiColorsProps);
All other configuration and use is the same as described in the Clocks2D section.
How should I use Chart2D to maximize performance and minimize memory usage?
There are three approaches to maximizing performance and minimizing memory usage when using Chart2D. The first is to create and configure objects as few times as possible (hopefully only once) and simply update them as necessary (i.e. with new data or labels). The Chart2D objects only need to be created and configured once. After that (and as long as a variable is kept to hold the Chart2D objects), the objects can be updated by re-calling some of the "set" methods of the properties objects and passing in the updated values. One thing to note here is that merely by keeping a reference to the graphical object (ex. LBChart2D, LLChart2D, or PieChart2D) one can access all its properties objects through its "get" methods. An update is usually 3 times faster than a full configure.
The next approach falls within the same category (to configure as few objects as possible). In this case what is done, is to use configured properties objects for more than one chart. Sometimes you'll want to create two "versions" of a single chart (i.e. a smaller one without a legend and a larger one with a legend). In this case, you can reuse all the property objects (except for the LegendProperties object which must be configured twice for example). The rule of thumb is that properties objects can be reused for multiple graphical objects if all the values for its settings (had there been two properties objects) would be the same.
The last approach has already been mentioned once. For this approach, each graphical object's size and preferred size are set using the "setSize (Dimension)" and "setPreferredSize (Dimension)" methods, respectively. This increases performance and memory usage because frees Chart2D from the burden of calculating a preferred size for the graphical object.